UltraRAG provides a convenient Case Study visualization mechanism to help researchers quickly check and analyze whether the built Pipeline works as expected.
After running the Pipeline, the system will automatically generate a memory log file in the output folder.
Just execute the following command to start the Case Study visualization webpage:
Please adjust parameters such as file path and port number according to the actual situation.
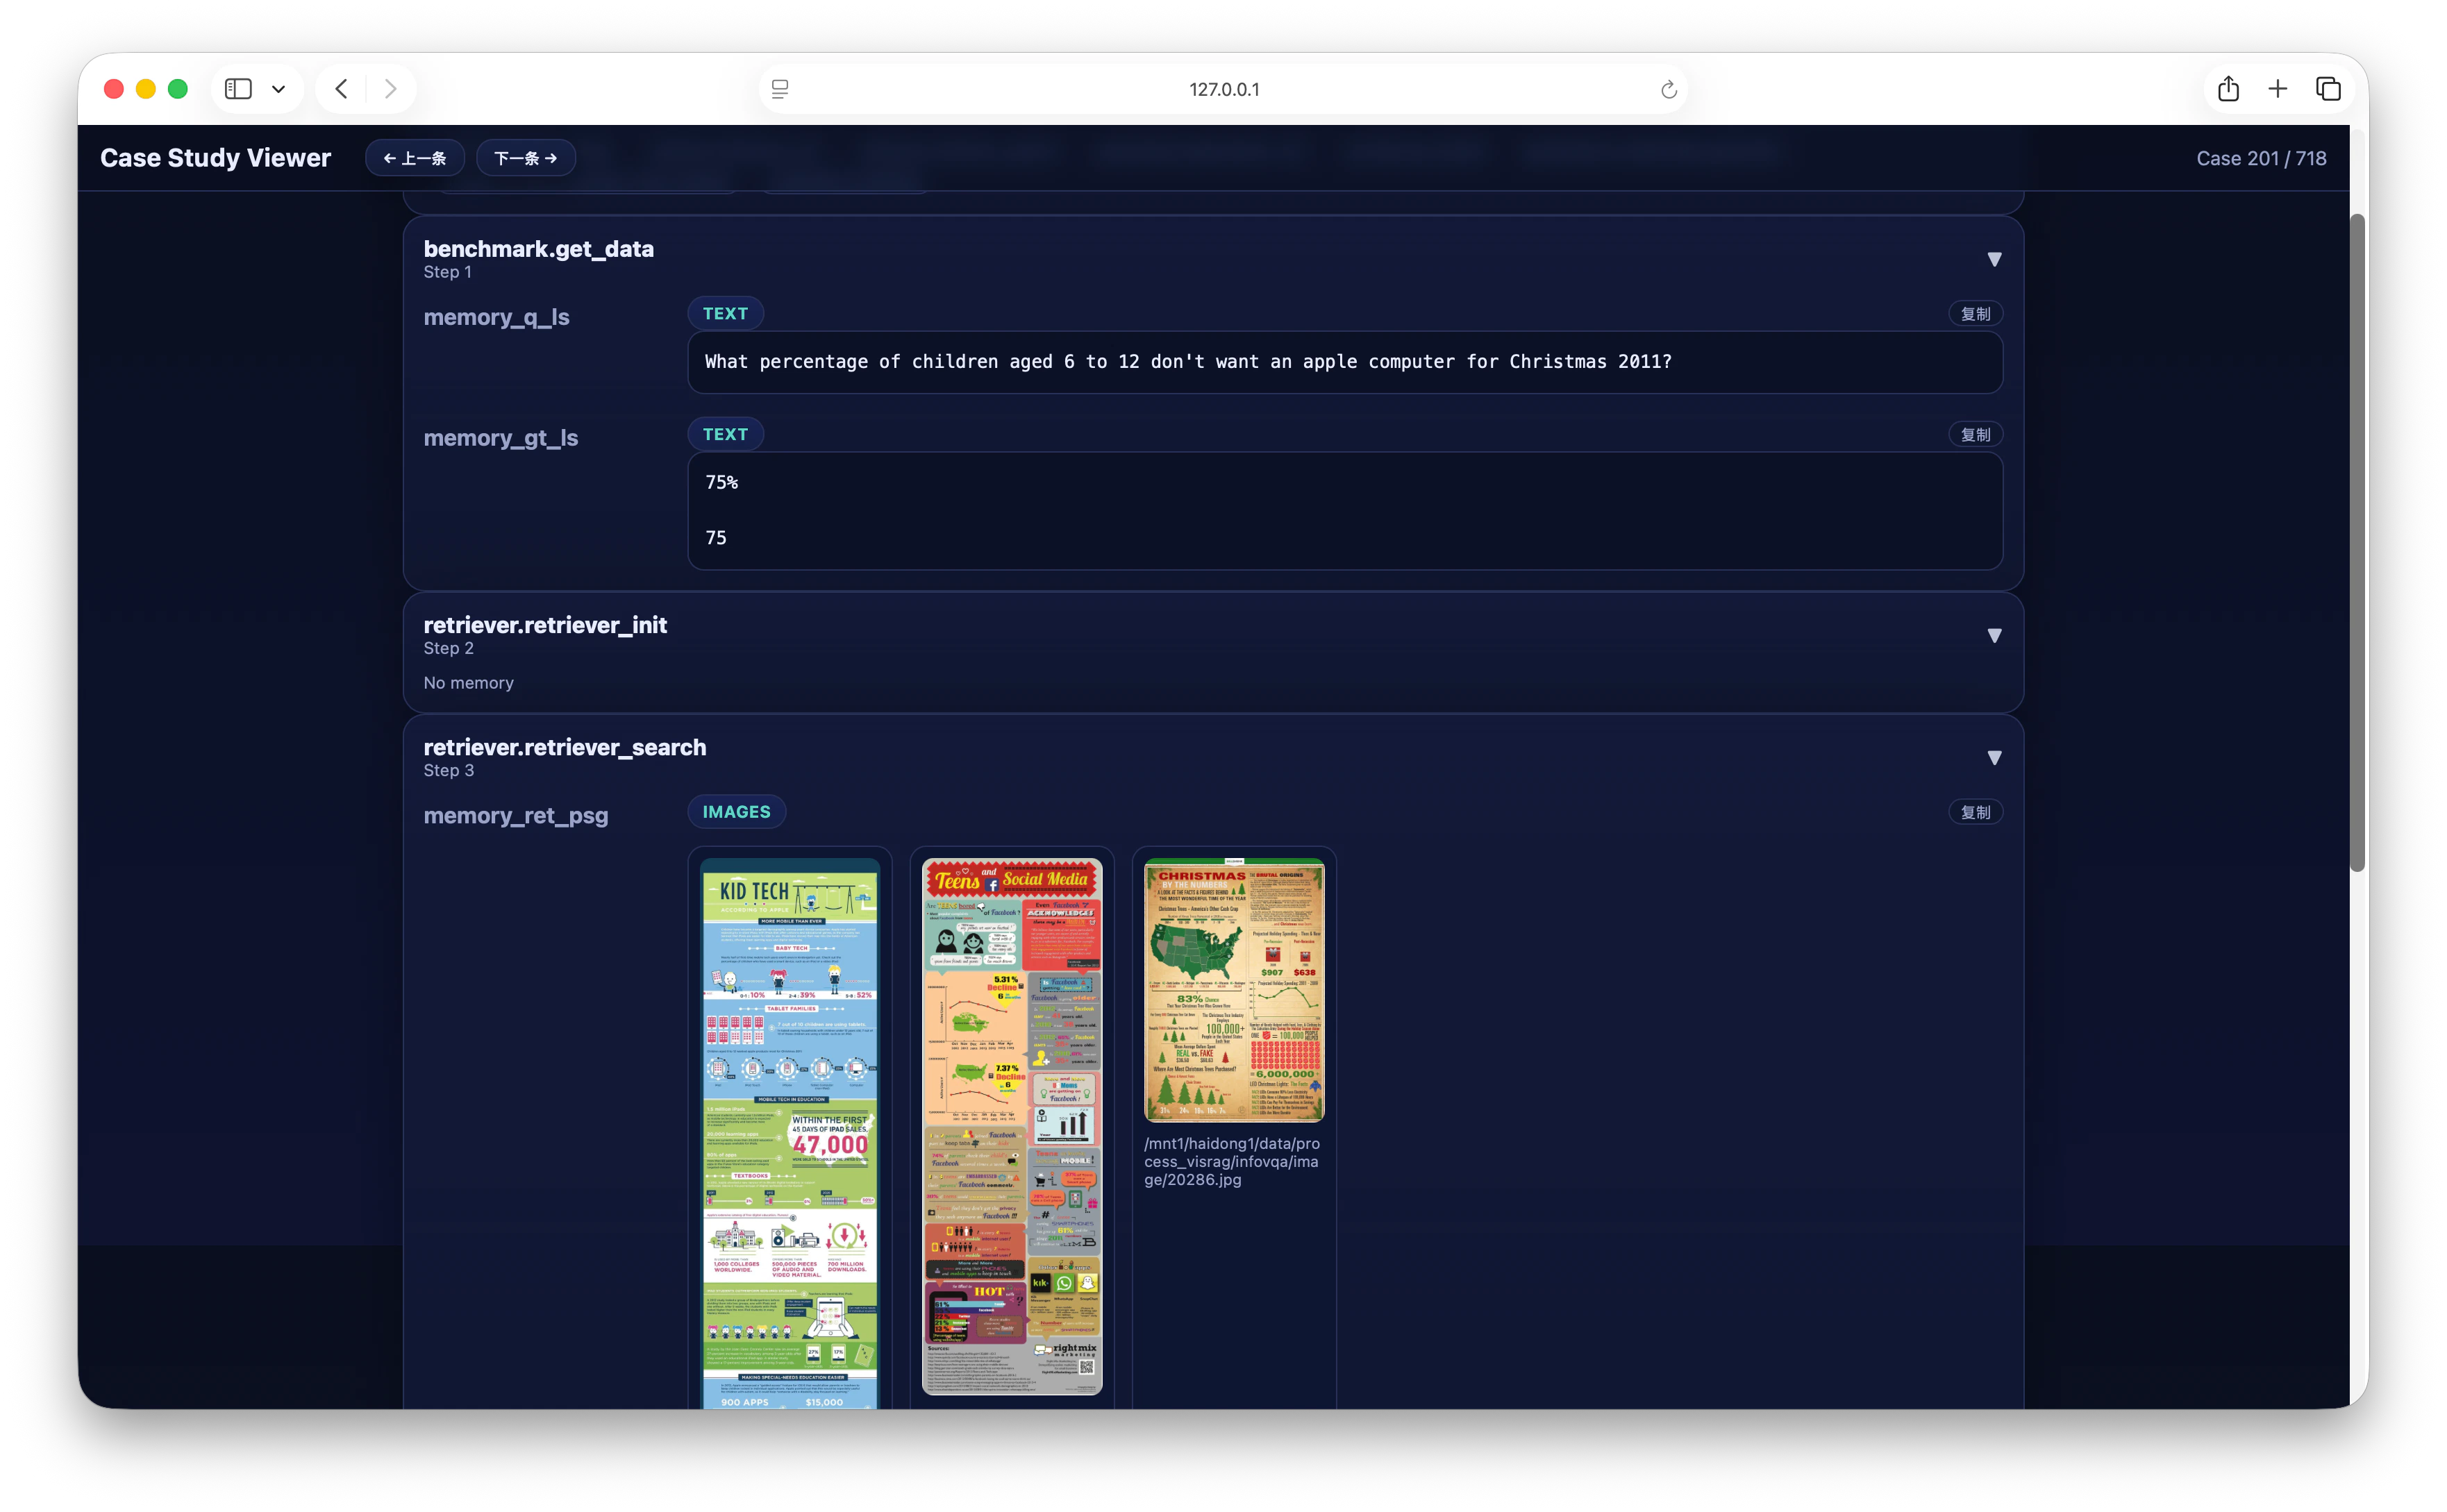 In the page, you can switch between different Cases one by one to intuitively compare the correspondence between
 input question, retrieval results, and model output, thereby more efficiently locating potential problems, optimizing Pipeline design, and verifying whether the entire reasoning process meets expectations.